Whether you’re new to trading or already have some experience, learning how to use the Fibonacci Retracement indicator can improve your trading strategies.
The Fibonacci Retracement indicator is a popular tool used by traders to identify possible levels of support and resistance in the market.
These levels can help you decide where to enter and exit trades, making it easier to navigate price movements.
We’ll explain what the Fibonacci Retracement indicator is, how it works, and how you can use it to make better trading decisions.
What is the Fibonacci Retracement Indicator?
The Fibonacci Retracement indicator is based on the Fibonacci sequence, a set of numbers where each number is the sum of the two preceding numbers.
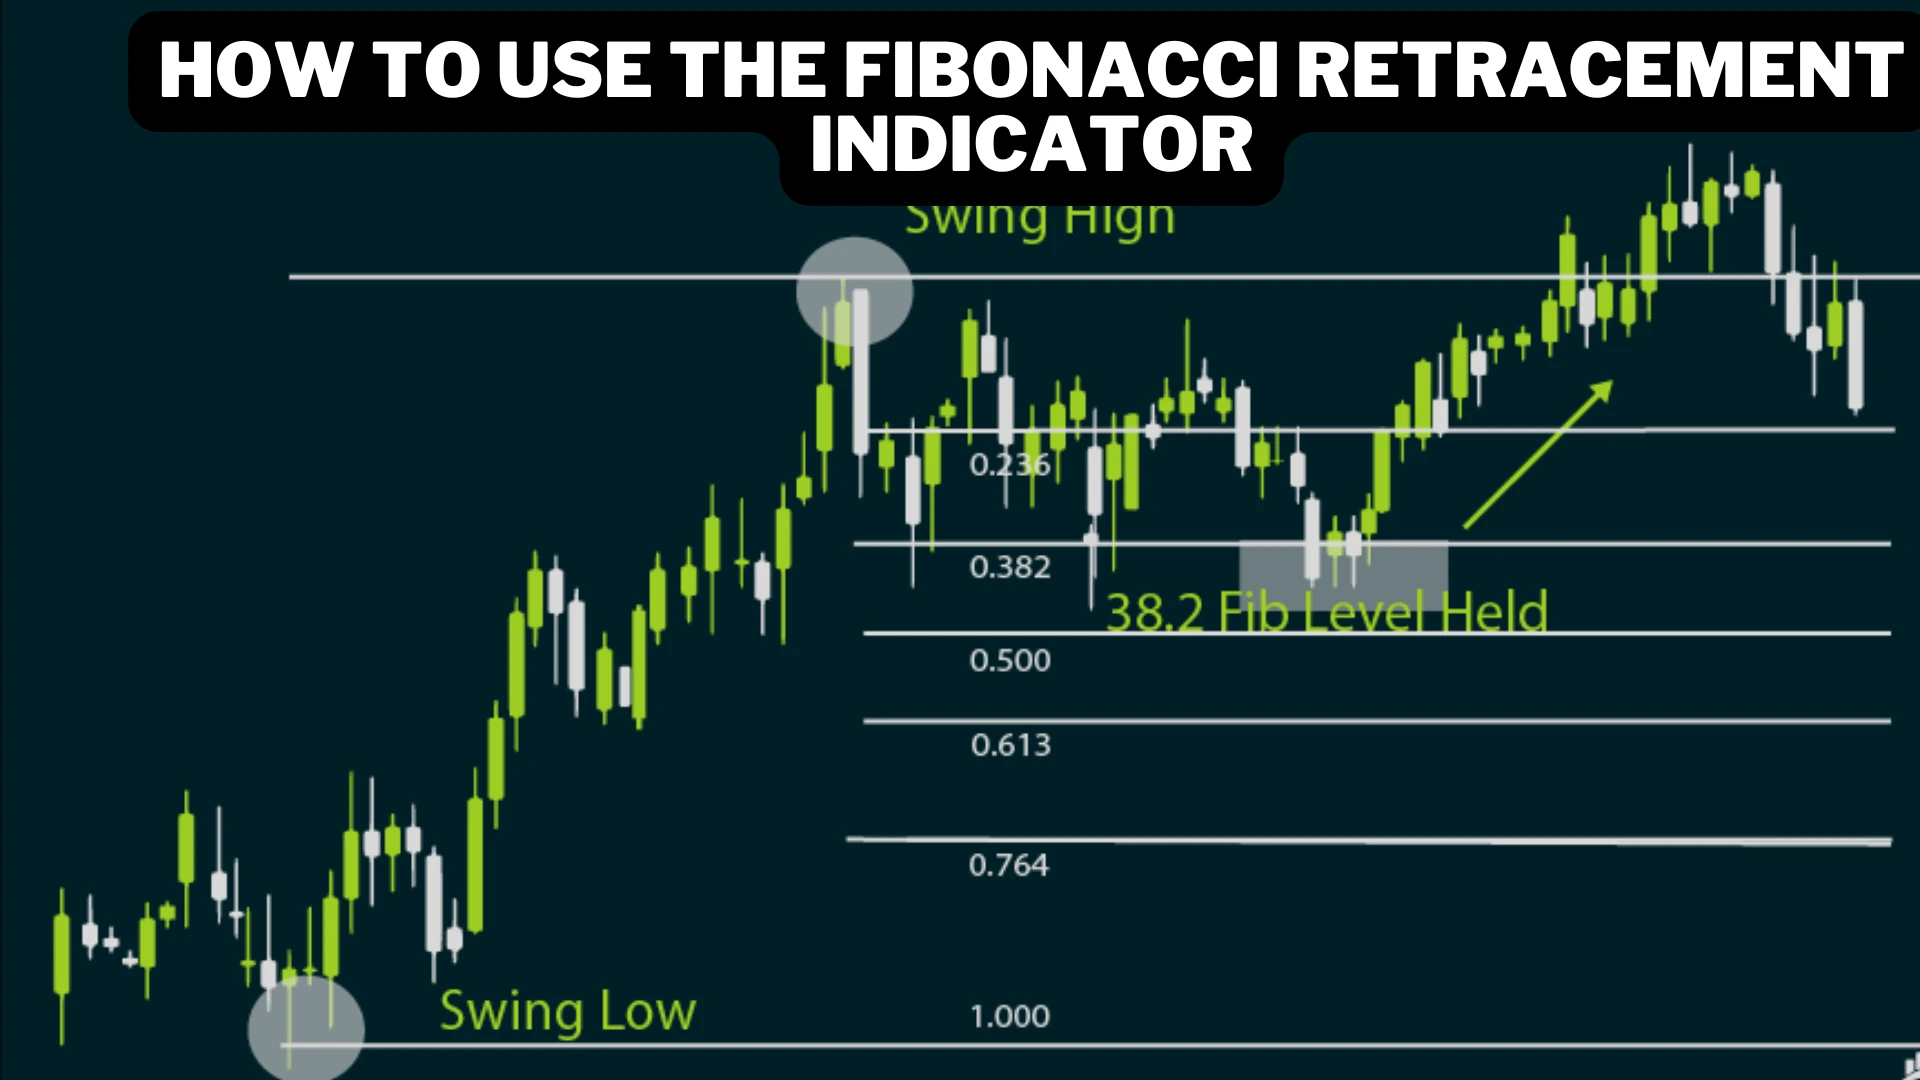
In trading, we don’t use the entire sequence but specific ratios derived from the sequence, such as 23.6%, 38.2%, 50%, 61.8%, and 100%.
These levels are plotted on a price chart to help traders spot potential areas where the price might reverse or stall during its movement.
The main idea is that after a significant price move, the market often retraces part of that move before continuing in its original direction.
How Does the Fibonacci Retracement Indicator Work?
When you apply the Fibonacci Retracement tool to a price chart, it automatically draws horizontal lines at the key Fibonacci levels.
These lines act as potential support or resistance levels where the price could either bounce or reverse.
- Support: This is where the price might stop falling and start rising again.
- Resistance: This is where the price might stop rising and start falling.
For example, if the price is moving upward and starts to pull back, you can use Fibonacci retracement levels to see where the price might find support and resume its upward move.
How to Use the Fibonacci Retracement Indicator in Trading?
Here’s a step-by-step guide to help you use the Fibonacci Retracement indicator in your trading.
1. Identify the Trend
Before using the Fibonacci Retracement tool, you need to identify the current trends in the market.
This means figuring out whether the market is in an uptrend (the price is moving higher) or a downtrend (the price is moving lower).
- Uptrend: Look for higher highs and higher lows.
- Downtrend: Look for lower highs and lower lows.
Once you know the direction of the trend, you can apply the Fibonacci tool to the chart.
2. Draw the Fibonacci Levels
After identifying the trend, you can now draw the Fibonacci Retracement levels on the price chart.
- In an uptrend: Click on the lowest point of the move and drag it to the highest point. The Fibonacci levels will show possible support levels where the price might retrace before continuing higher.
- In a downtrend: Click on the highest point of the move and drag it to the lowest point. The Fibonacci levels will show possible resistance levels where the price might retrace before continuing lower.
The tool will automatically draw horizontal lines at key levels like 23.6%, 38.2%, 50%, 61.8%, and 100%.
3. Look for Trade Opportunities
Once the Fibonacci levels are drawn, watch how the price reacts when it reaches these levels.
- In an uptrend: If the price pulls back to one of the Fibonacci levels (like 38.2% or 61.8%) and then starts to rise again, this could be a good point to buy. The level acts as support, and the price is likely to continue moving higher.
- In a downtrend: If the price retraces up to a Fibonacci level and starts to fall again, this could be a good point to sell. The level acts as resistance, and the price is likely to continue moving lower.
How to Combine Fibonacci Retracement with Other Indicators?
While the Fibonacci Retracement tool is powerful on its own, it becomes even more effective when combined with other technical indicators. Here are a few ways you can enhance your trading strategy:
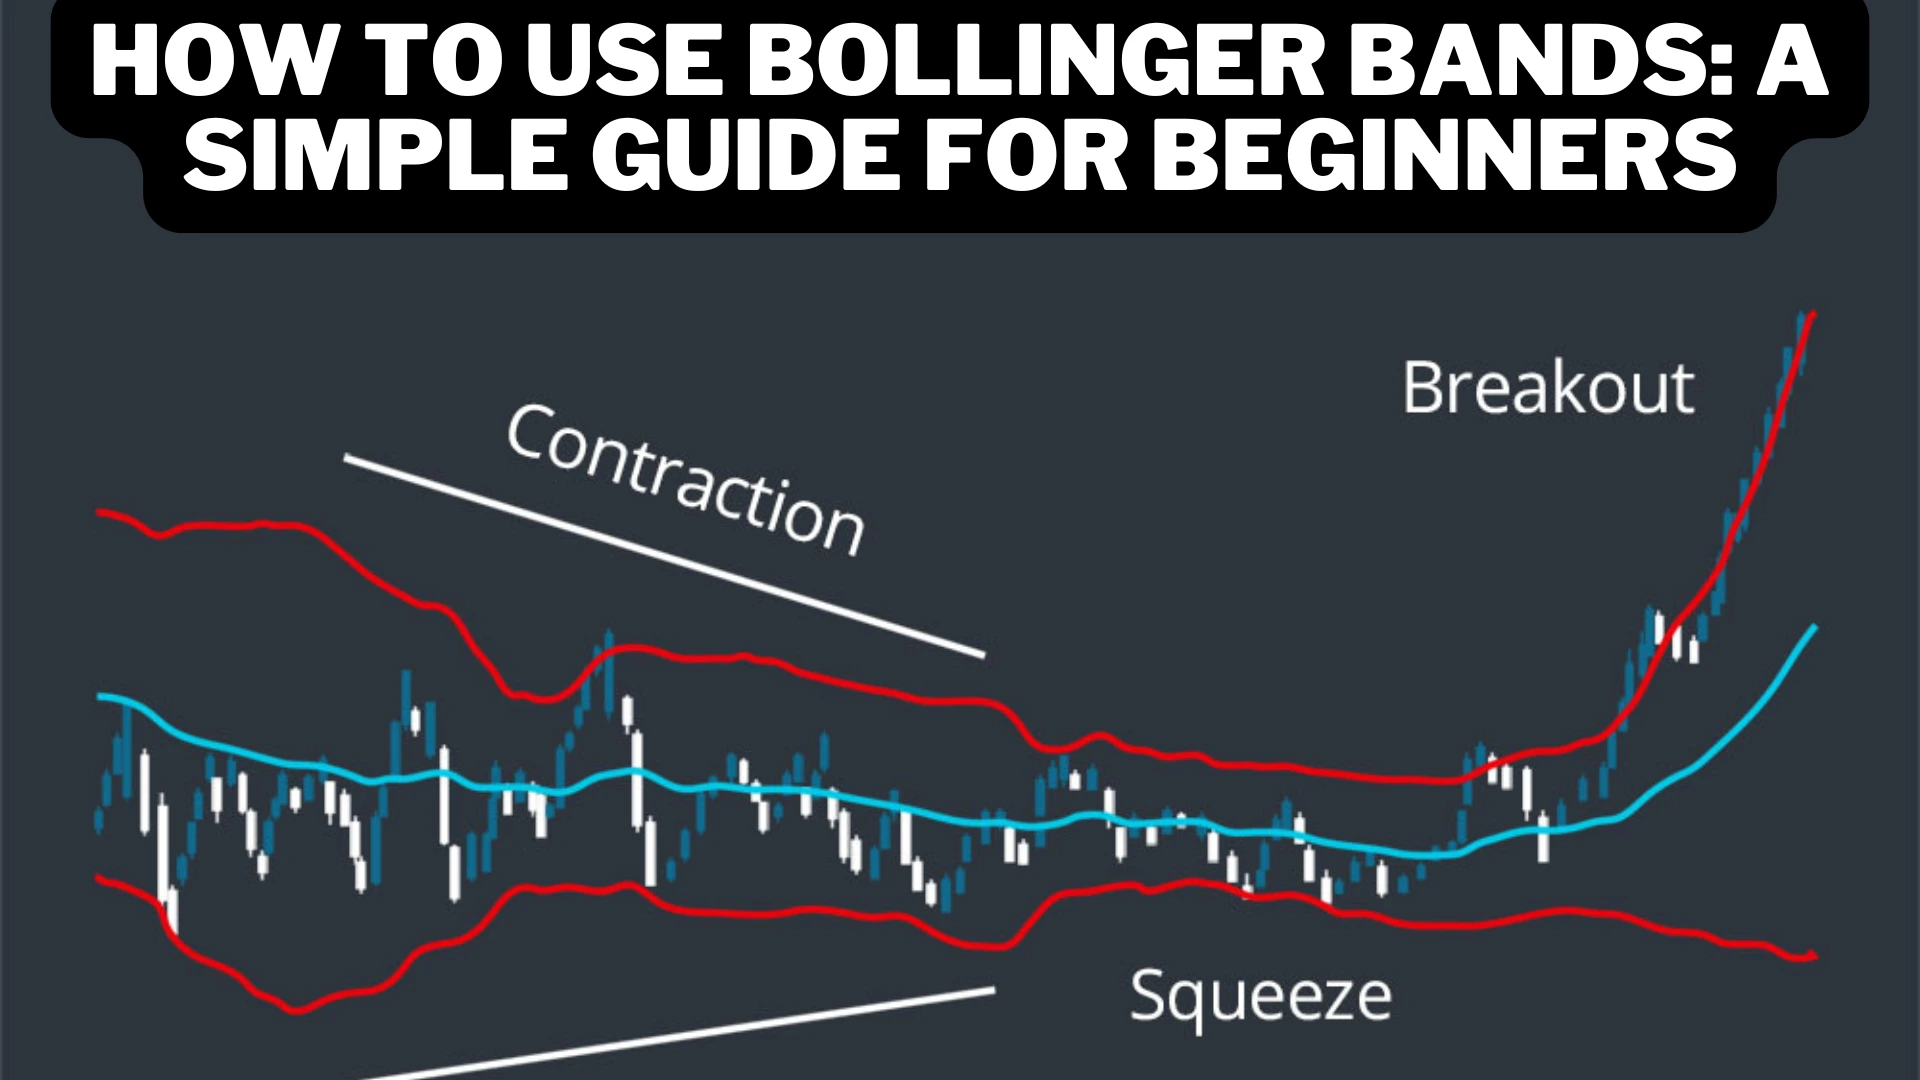
1. Fibonacci and Moving Averages
You can combine Fibonacci levels with moving averages to confirm your trades.
For example, if the price retraces to a Fibonacci level and there’s a moving average nearby, it strengthens the chance that this level will act as strong support or resistance.
2. Fibonacci and Trendlines
When you use Fibonacci levels alongside trendlines, it gives you extra confirmation of whether the price is likely to reverse or continue its trend.
If a Fibonacci level coincides with a trendline, the chances of a reversal or bounce increase.
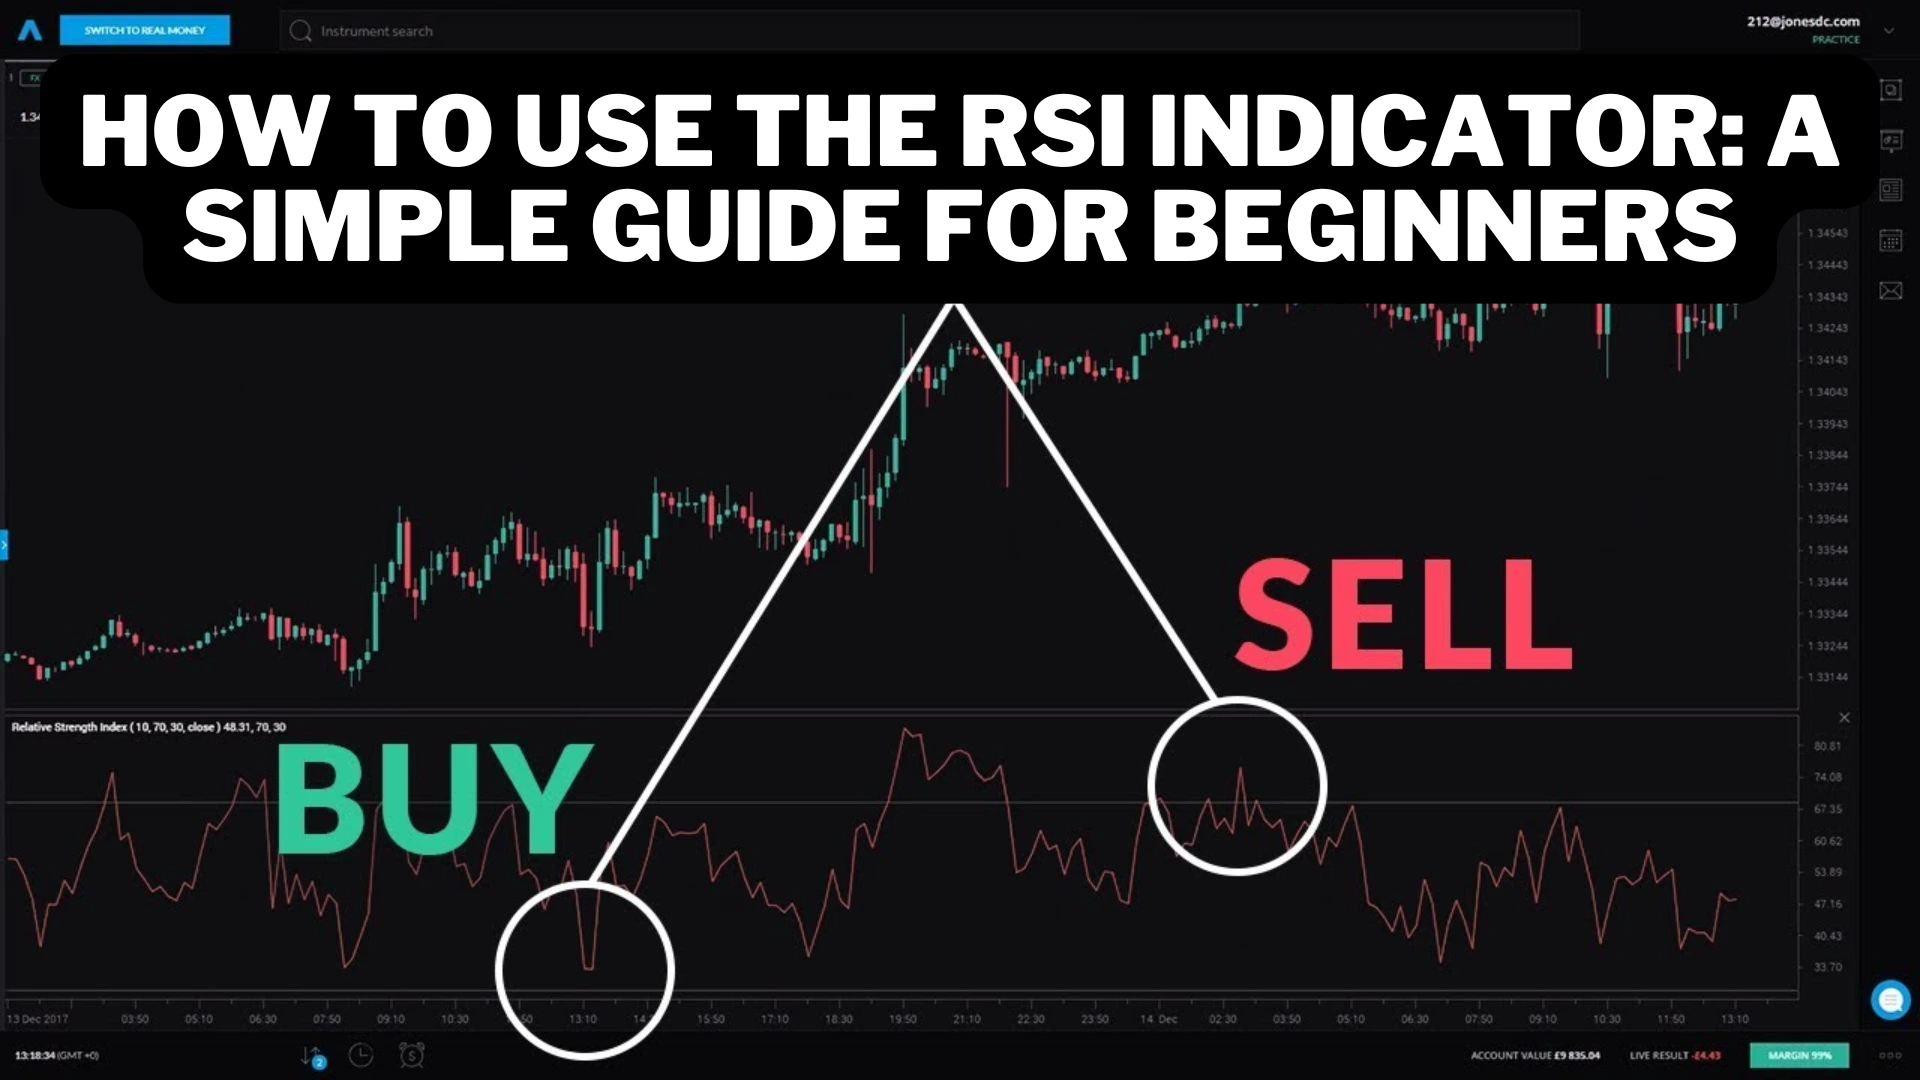
3. Fibonacci and RSI
The Relative Strength Index (RSI) can also help confirm the signals from Fibonacci levels.
For example, if the price reaches a Fibonacci retracement level, and the RSI shows the asset is overbought or oversold, this can be a strong indication that a reversal might happen soon.
Example of Using Fibonacci Retracement
Let’s go through a simple example to see how the Fibonacci Retracement indicator works in real life:
Imagine the price of a stock rises from $100 to $150 in an uptrend. You believe the price may pull back before continuing higher. To find out where it might find support, you use the Fibonacci Retracement tool.
- Click on the lowest point ($100) and drag it to the highest point ($150).
- The tool now shows Fibonacci levels, such as 23.6% ($138.20), 38.2% ($130.90), and 61.8% ($119.10).
If the price starts falling and reaches the 38.2% level, you might watch to see if it bounces and starts rising again. If it does, you might decide to enter a buy trade, expecting the price to continue its uptrend.
Tips for Using Fibonacci Retracement
- Don’t Rely on Fibonacci Alone: While Fibonacci levels can be helpful, it’s important to combine them with other indicators and signals to avoid false trades.
- Use Multiple Timeframes: Checking Fibonacci levels across different timeframes (like daily and weekly charts) can give you a better idea of key support and resistance levels.
- Be Patient: Wait for confirmation before jumping into a trade. If the price is approaching a Fibonacci level, watch how it behaves before making your move.
- Practice on a Demo Account: If you’re new to using the Fibonacci Retracement tool, it’s a good idea to practice on a demo trading account first. This way, you can get a feel for how it works without risking real money.
Conclusion
The Fibonacci Retracement indicator is a valuable tool for traders who want to identify potential support and resistance levels in the market.
By using this tool, you can make more informed decisions about when to enter or exit trades.
Remember, the Fibonacci tool works best when combined with other indicators and strategies, so always use it as part of a broader trading plan.
With practice and patience, you can use the Fibonacci Retracement indicator to spot great trading opportunities and improve your overall trading performance.